Recent release of TIBCO Spotfire 10.7 introduced some great features. Native Python Data Functions have enabled new opportunities for us. This post is about one of these possible use cases -
Using Python based charts in and from Spotfire.
Interesting ? Let's do it !
A few things to Remember
- This is just an experiment as of now, so use at your own risk🙄
- I have observed performance issues while using larger data sets. Be careful with this.
- The setup works nicely at Spotfire Client level as of now. To make it work on webplayer, contact your Admin to install required packages.
- Charts used within Spotfire with this approach will not be responsive, but they can be made to respond Filtering and limit by Marking.
- Size of charts will not adjust based on screen size, so need to define it based on usage.
Installing Packages for Spotfire Client
The comprehensive post about installing python packages is available with
TIBCO Community Article, I am just taking key takeaways here.
- Find the Spotfire Installation Directory. One can do it by Right Click on Desktop Icon and Open file Location.
- Navigate till \Modules\Python Interpreter_[VERSION]\python\
- Open Command Prompt at this location.
- Update pip and setuptools using below commands, one at a time-
python.exe -m pip install --upgrade pip
python.exe -m pip install -U pip setuptools
- Start Installing Packages. Execute below commands one at a time -
python.exe -m pip install plotly
python.exe -m pip install psutil requests
python.exe -m pip install ipywidgets
python.exe -m pip install jupyterlab
python.exe -m pip install orca
Installing orca for Spotfire
To work with static images in Plotly Python, orca executable binaries are needed. They need to be configured properly to work with Spotfire. Here are the steps to do so -
- Download windows-release.zip from GitHub.
- Extract and Install.
- After installation, it leaves a shortcut on Desktop. Right click and open file location.
- Copy the location of orca.exe and keep it safe.
- Locate Python folder in Spotfire Installation directory (\Modules\Python Interpreter_[VERSION]\python\).
- Inside this folder, reach till \Lib\site-packages\plotly\io and open _orca.py
- Look for below lines of code -
# Try to find an executable
# -------------------------
# Search for executable name or path in config.executable
executable = which(config.executable)
path = os.environ.get("PATH", os.defpath)
formatted_path = path.replace(os.pathsep, "\n ")
- Replace these lines with below, and use the path retrieved from step #4. Actually just replacing the first row is enough, other are given for identifying correct segment of code -
# Try to find an executable
# -------------------------
# Search for executable name or path in config.executable
executable = r"C:\Users\UserName\AppData\Local\Programs\orca\orca.exe"
path = os.environ.get("PATH", os.defpath)
formatted_path = path.replace(os.pathsep, "\n ")
- Save and close the file.
Creating Visualization
- Go to Data > Data Function Properties
- Register New...
- Set Type to Python script
- Provide Script. I have provided basic Bar Chart example, but you can use others too in similar way -
import plotly.express as px
# data is input parameter (from Spotfire Data Table)
# Row below configures X, Y and Color Axis
# hover_data sets the tooltip, if you are plannimng to use Chart externally
# height specifies heght of chart generated
fig = px.bar(data, x='Date', y='Price',
hover_data=['Date', 'Price'], color='Price',
labels={'Date':'Dates'}, height=580)
#fig.show() # Launches Chart in Browser
# Saving Image Binary Data in variable u
u=fig.to_image(format="png")
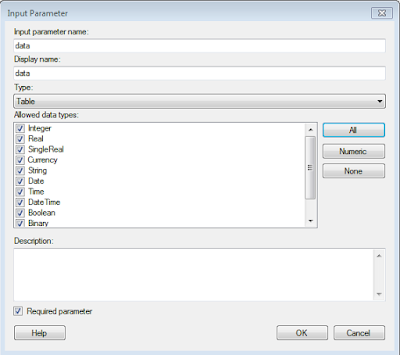
- Set Input Parameter data as Table type-

- Set Output Parameter u of type Value.
- Run and Check Refresh Function Automatically.
- In Input , Select Parameter data and set Input handler to Columns.
- Select Data Table of interest from Drop-down and select Columns.
- Click Columns button and Select X and Y Axis columns of your chart from dialog.
- In case you are interested in Limiting data based on Dashboard Marking and Filtering, configure Limit by section.
- Click OK and go to Output
- Select Output Parameter u and Set Output handler to Document property.
- Create and Select New property to store image binary data.
- Click OK and Close
Using Charts in Dashboard
- Create a Text Area and insert a Label property.
- Select Property storing Image binary data from last section.
- Save and Exit Edit mode.
Sample Output